So the 2022 tax-supported budget launched last week, and I wrote about it for City Hall Watcher. The post is subscribers-only, but I made some stuff for it I’ve gotta share here.
The capital budget unveiled last week includes $46 billion in new infrastructure, facilities, and equipment; state-of-good-repair (SOGR) projects; new affordable housing developments; and more. But there’s quite a few planned but unfunded projects that didn’t make it in.
The previous City Manager, Peter Wallace, frequently used an infographic of an iceberg to represent this hidden backlog. It became a cult favourite among people who watch way too many budget presentations (I even made fan art). The Toronto Star’s David Rider filed a freedom of information request to uncover its mysterious origins, which was apparently the nail in the iceberg’s coffin. It was retired by City staff…and now it’s being resurrected by me.
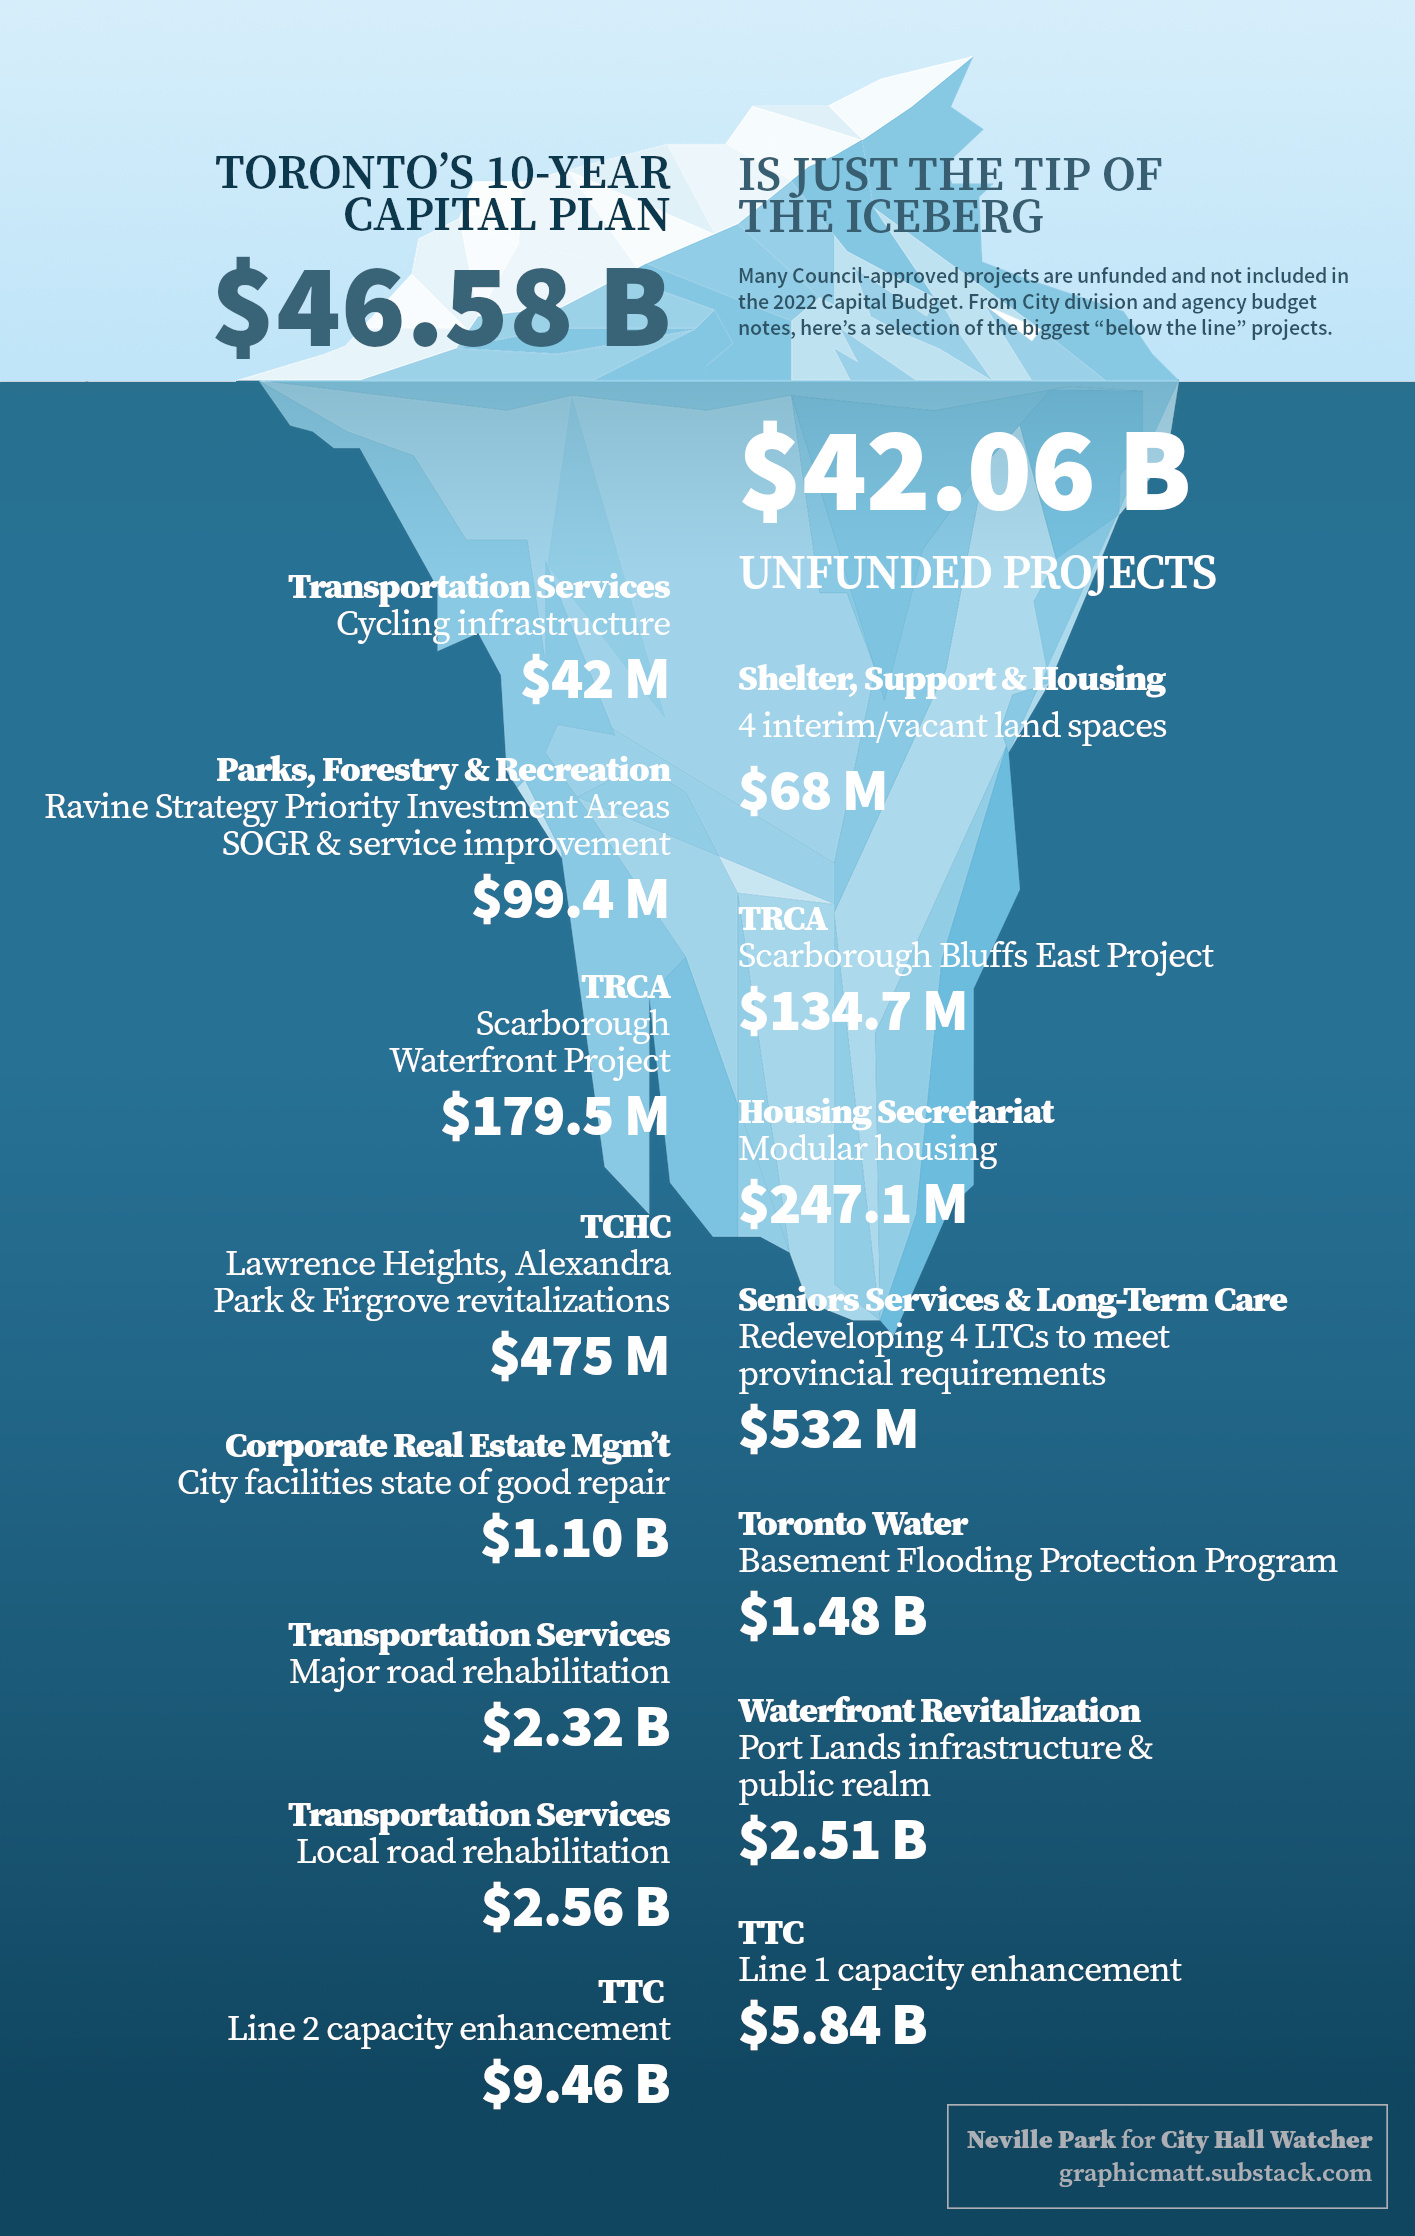
This year, all the budget notes included a section on “capital needs constraints”. The infographic highlights some of the biggest ones, but I compiled all that I could find into a sortable, searchable table; you can download the data as well.
Altogether it totals over $42 billion, with the majority in public transit and transportation-related projects:
I've been wanting to do this for a long time, and I'm grateful that City staff made it so easy. Please do share my giant iceberg baby.